> For the complete documentation index, see [llms.txt](https://docs.ag5.com/llms.txt). Markdown versions of documentation pages are available by appending `.md` to page URLs; this page is available as [Markdown](https://docs.ag5.com/data-management/advanced-analytics-api/example-kpis-and-dashboards-advanced-analytics-api.md).
# Example KPIs and Dashboards - Advanced Analytics API
This article gives some example KPIs and dashboards that can be calculated /created with the Advanced Analytics API.
### KPIs
**Number of results**
Meaning: How many results are added into the system in total (is also used to calculate the AG5 subscription fee)
Method: Sum the total amount of records in the Achievement table
Application: As a Scorecard (one number) or as aTime series chart (evolution over time)
**Repository compliance**
Meaning: How compliant is the whole workforce in the repository.
Method: There are many different ways to calculate this average, but we suggest to use EmploymentQualificationCompliance where you calculate the Average compliance\_score for the records with one of the following values in compliance\_status:
```
'allFine', 'expiresSoon', 'levelTooLowSoon', 'expired', 'revokedRequired', 'failed', 'levelTooLow', 'required'
```
> Please note that we do not include the statuses where the Qualification is not required. Also see the important note about ‘partial compliance’ at the end of the [article](https://help.ag5.com/articles/93-compliance-calculations-advanced-analytics-api) about compliance calculations. And finally, be aware that this calculation does not include the count-rules.
Application: As a Scorecard (one number) or as a Time series chart (evolution over time)
**Number of accounts**
Meaning: How many people have access to AG5? Which could be an indicator for the progress in the roll-out of the AG5 application.
Method: The RepositoryStatistics Event stores the field accounts\_count every day
Application: As a Scorecard (one number) or as a Time series chart (evolution over time)
***
### Dashboards
**Alert list as chart(s)**
Meaning: The Alert list in the AG5 product shows the status of the Employee-Qualification Compliance in three colors: Green (Fine), Orange (Warning), Red (Problem). These statuses and their colors can be represented as a chart which will give a visual representation of the compliance status of the repository.
Method:
The EmploymentQualificationCompliance Events table stores the Alert list data for each date.
* Group the Compliance events of a date by their ‘Color’
| compliance\_status | color |
| ---------------------------------------------------------------------------------------- | ------ |
| 'allFine', 'revokedNotRequired',
'failedNotRequired', 'validNotRequired'
| Green |
| 'expired', 'revokedRequired',
'failed', 'levelTooLow', 'required'
| Red |
| 'expiresSoon', ‘expiresSoonNotRequired’,
'levelTooLowSoon', 'requiredSoon'
| Orange |
* Display the count per color
> Note: you can decide to exclude the scores for the qualifications that are ‘NotRequired’, but this depends on your Skills Management Strategy.
Application:
As a Pie chart (for a specific date) or as a Time series chart (evolution over time)
#### 
***
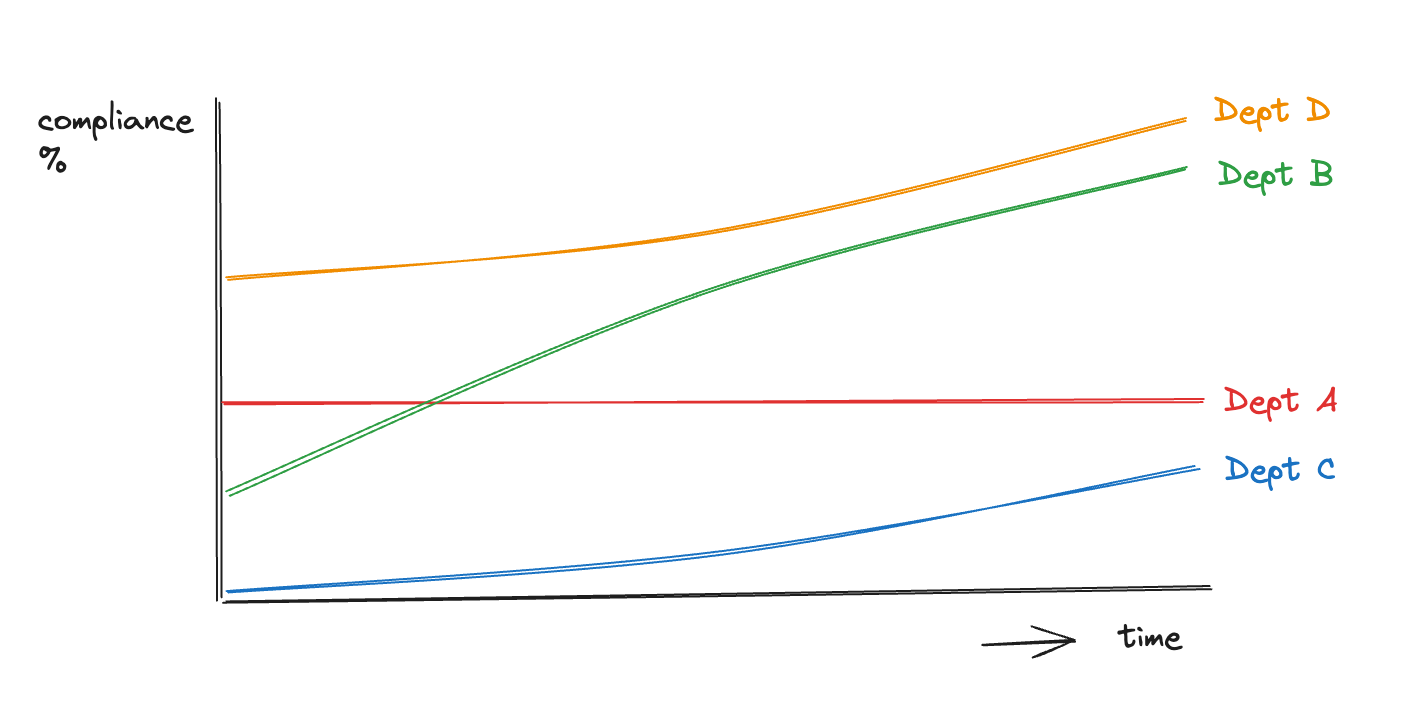
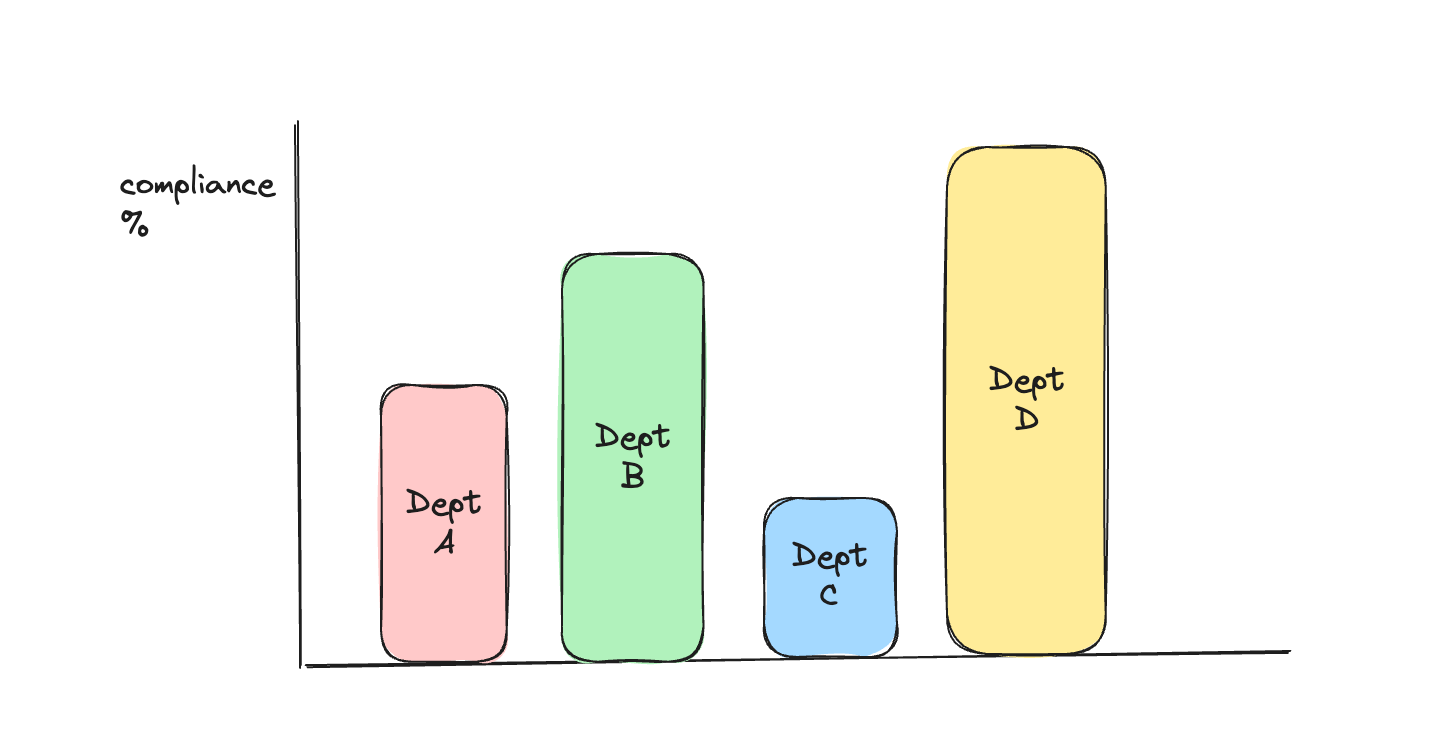
**Compare compliance between departments**
Meaning: See how departments compare in their compliance score and which departments can learn from each other.
Method:
The GroupingCompliance Event has different compliance score calculations (see the [article](https://help.ag5.com/articles/93-compliance-calculations-advanced-analytics-api) about compliance calculations).
To compare some specific departments:
* First find their id in the Grouping Entity table.
* Then filter the GroupingCompliance Events on those grouping\_ids
* Display the preferred compliance\_score (Isolated compliance, Contextual compliance, Positional compliance or Count rule compliance)
To compare all departments:
* First find the id for ‘Department’ in the GroupingType Entity table.
* Then filter the GroupingCompliance Events on the grouping\_ids with that grouping\_type\_id
* Display the preferred compliance\_score (Isolated compliance, Contextual compliance, Positional compliance or Count rule compliance)
> Note: you will need to filter out the GroupingCompliance Events where the num\_required is zero in order to keep the groupings with no requirements from influencing the average.
Application:
As a Pie chart or Bar chart (both for a specific date) or as a Time series chart (evolution over time)
 ***
***
**Compare compliance between locations**
Meaning:
Compare locations on their compliance scores and identify which locations can learn from each other.
Method:
The GroupingCompliance Event has different compliance score calculations (see the [article](https://help.ag5.com/articles/93-compliance-calculations-advanced-analytics-api) about Compliance Calculations). In this example, we assume that every location consists of multiple sub-groupings (departments, teams etc).
To compare some specific locations:
* First find their id in the Grouping Entity table.
* Create a hierarchy by using the parent\_id in the Grouping Entity table.
* Collect the ids of the subgroupings for each location from the Grouping Entity table.
* Compute the average of the preferred compliance\_score in the GroupingCompliance Events table for the subgrouping’s grouping\_ids
* Display the aggregated compliance\_score (Isolated compliance, Contextual compliance, Positional compliance or Count rule compliance).
> Note: you will need to filter out the GroupingCompliance Events where the num\_required is zero to keep the groupings with no requirements from influencing the average.
Alternative way Use the EmploymentQualificationCompliance Events
* If necessary, transform the Position Entity table, so that the grouping\_ids column is unpivoted. This means that if a position has multiple tagged groupings, a row is created for each grouping\_id with the general Position fields (like employment\_id).
* Join the EmployeeQualificationCompliance Events table with the Employment Entity table which in its turn is joined with the Position Entity table.
* Filter the EmployeeQualificationCompliance Events with the Position grouping\_ids that correspond with the needed Locations (a hierarchy like in the previous example might be needed) and aggregate (average) the complance\_score
> Note: you will need to filter out the EmploymentQualificationCompliance events where the required\_score is zero in order to keep the situations where a qualification is not required for the employee from influencing the average.
Application:
As a Pie chart or Bar chart (both for a specific date) or as a Time series chart (evolution over time). (for pictures, see previous example)
***
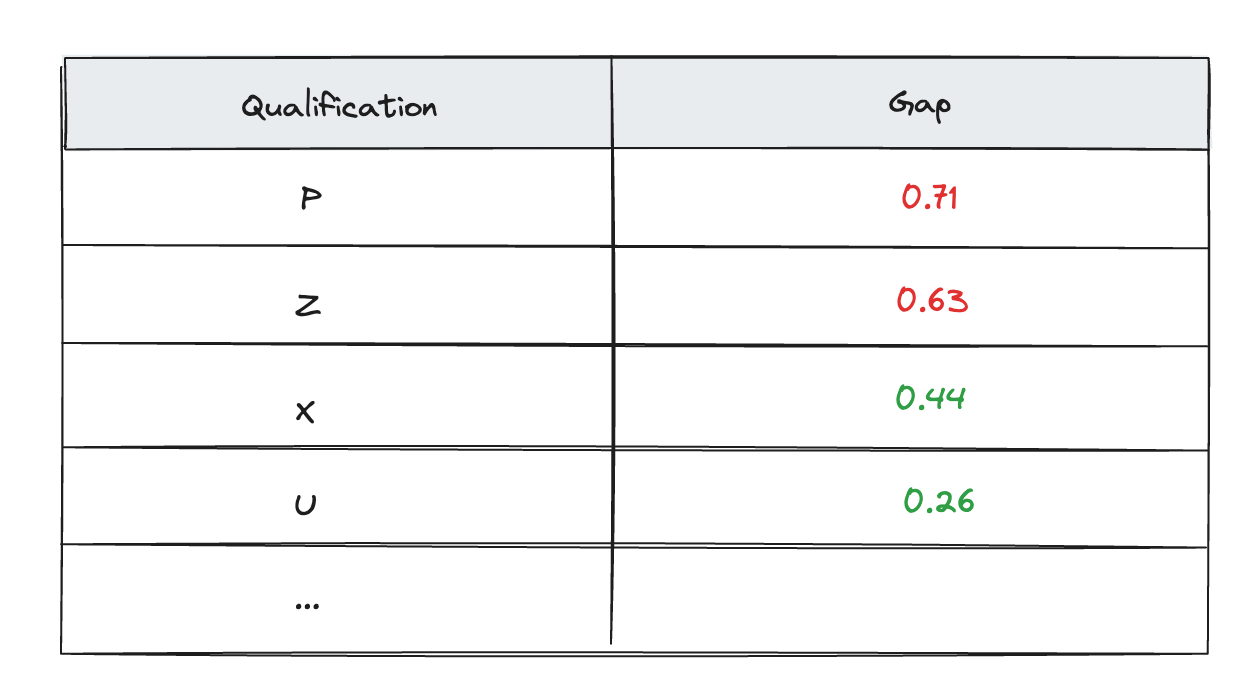
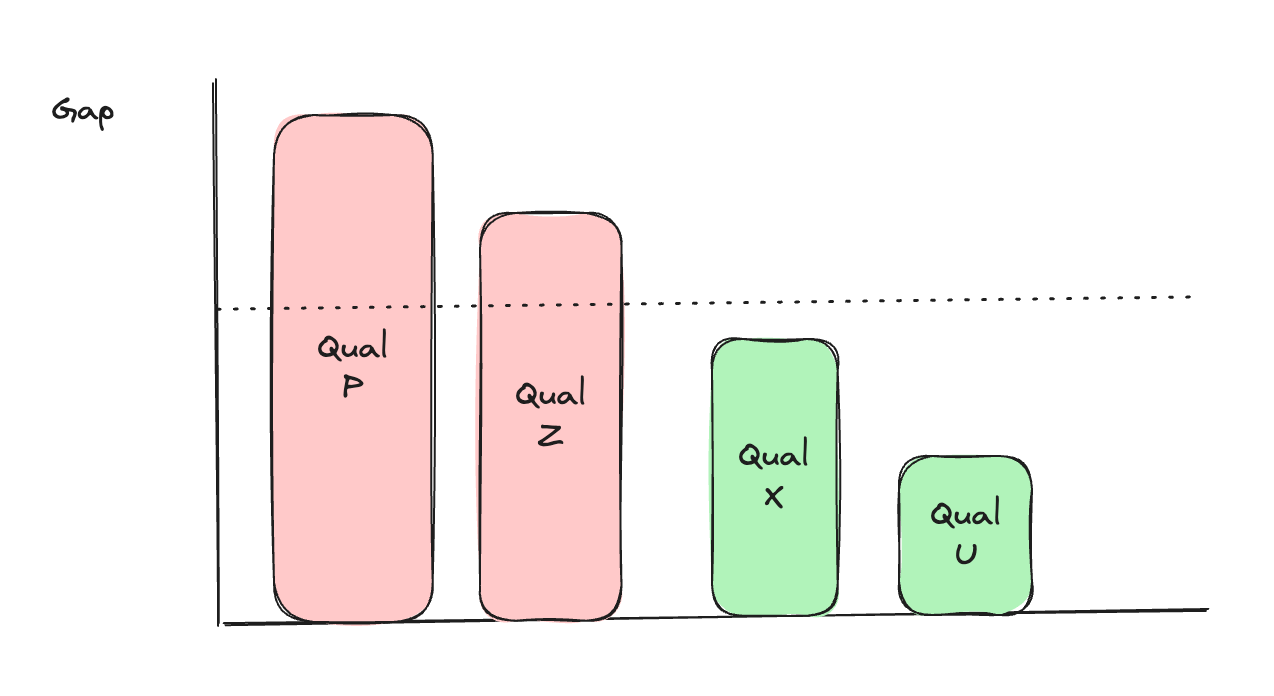
**Show the qualifications with the biggest gap**
Meaning:
Get the top 10 qualifications with the biggest gap (lowest compliance). For this the Qualification Compliance needs to be calculated
Method:
* Join the EmployeeQualificationCompliance Events table with the Qualifications Entity table.
* Calculate the average compliance\_score for all Events on a certain date for each Qualification : The Qualification Compliance.
* Make sure you filter out the events where the required\_level is zero before calculating the average
* Sort the average compliance\_scores from lowest to highest. Or calculate the Gap as (1 - compliance\_score) and sort from highest to lowest. Display the top 10.
Application:
As a Bar chart or table.
 ***
***
**Show the best performing Employees**
Meaning:
Get a top 10 of Employees with the biggest gap (highest compliance). For this the Employee Compliance needs to be calculated
Method:
* Join the EmployeeQualificationCompliance Events table with the Qualifications Entity table.
* Calculate the average compliance\_score for all Events on a certain date for each Employment: The Employee Compliance.
* Make sure you filter out the events where the required\_level is zero before calculating the average
* Sort the average compliance\_scores from highest to lowest. Display the top 10.
Application:
As a Bar chart or table. (for pictures, see previous example)
---
# Agent Instructions
This documentation is published with GitBook. GitBook is the documentation platform designed so that both humans and AI agents can read, navigate, and reason over technical content effectively. Learn more at gitbook.com.
## Querying This Documentation
If you need additional information that is not directly available in this page, you can query the documentation dynamically by asking a question.
Perform an HTTP GET request on the current page URL with the `ask` query parameter, and the optional `goal` query parameter:
```
GET https://docs.ag5.com/data-management/advanced-analytics-api/example-kpis-and-dashboards-advanced-analytics-api.md?ask=&goal=
```
`ask` is the immediate question: it should be specific, self-contained, and written in natural language.
`goal` is optional and describes the broader end goal you are ultimately trying to accomplish on behalf of the user. GitBook uses it to tailor the answer towards what is most useful for that goal.
The response will contain a direct answer to the question and relevant excerpts and sources from the documentation.
Use this mechanism when the answer is not explicitly present in the current page, you need clarification or additional context, or you want to retrieve related documentation sections.